More often than not, software doesn’t work on the first try. This tutorial will explain the basics of Cappuccino debugging.
As mentioned in chapter on development environment, modern browsers provide tools to debug JavaScript. There is Firebug for Firefox, Debug Bar for Internet Explorer and the embeded Developer tools in all WebKit browsers (Safari, Chrome, Chromium etc). In this tutorial, we are going to use the WebKit debugger, which is one of the most powerful tool for web application development.
Open index.html of the starter app in the browser. You will see the “Hello world”
label displayed.
Open the debugger. In Safari, it’s located under Development > Display Error Console. In Chrome it’s found under Presentation > Developers Options > JavaScript console.
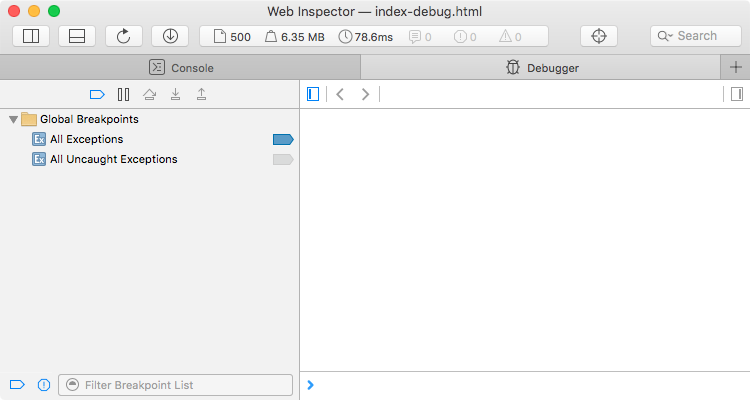
This is what the inspector looks like in Safari:
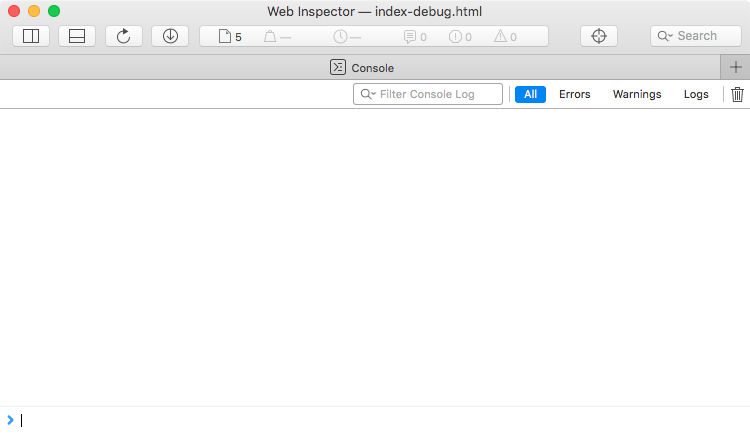
As you can see it’s empty. You have several tools you access from the toolbar:
We are going to mainly use Script and Console in this tutorial.
The most basic tool in the developer’s toolbox is logging.
Open the AppController.j of the starter app, and add the following code:
// [...]
- (void)applicationDidFinishLaunching:(CPNotification)aNotification
{
// [...]
[contentView addSubview:label];
[theWindow orderFront:self];
// log the content of the label
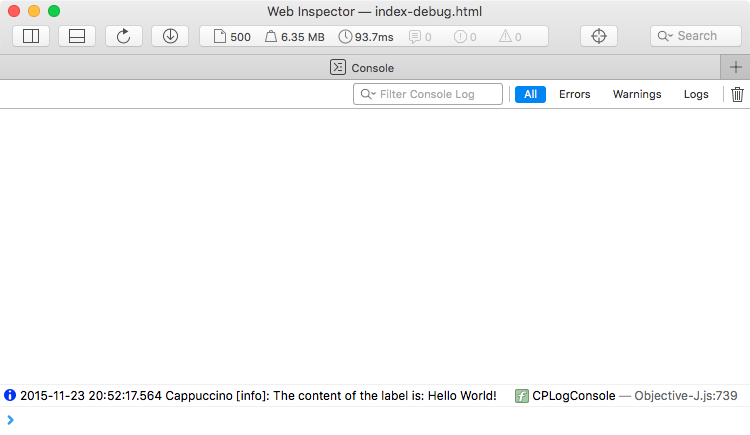
CPLog.info("The content of the label is: " + [label stringValue]);
}
Reload the app, open the Debugger and select the Console tool. You
will see nothing!
his is normal, because you have opened index.html which logs nothing by default. Now open
index-debug.html, and select the Console tool:
Info You can enable logging in index.html as well by registering a logger using CPLogRegister.
There are 6 logging levels: fatal, error, warn, info, debug and trace. You use them with CPLog.fatal(), CPLog.warn(), CPLog.info() etc.
It is generally a good idea to log verbosely when you develop and then to eliminate logging statements, or to switch them to a lower level so as to suppress them when the app becomes more mature.
Sometimes a problem is too complex to be cracked by logging alone, and a more powerful tool is called for: the Debugger.
Let’s add bad code in our AppController.j:
// [...]
- (void)applicationDidFinishLaunching:(CPNotification)aNotification
{
    // [...]
    [contentView addSubview:label];
    [theWindow orderFront:self];

    // log the content of the label
    CPLog.info("The content of the label is: " + [label stringValue]);

    // I'm gonna crash!
    [notDefinedVariable doSomethingNotDefined:withAnotherNotDefinedVariable];
}
Reload index-debug.html and look at the Console:
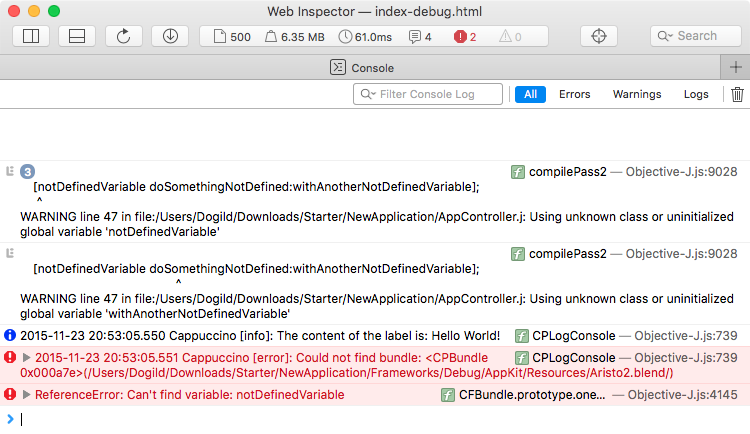
There are compilation warnings such as WARNING line 47 in file:/Users/Dogild/Downloads/Starter/NewApplication/AppController.j: Using unknown class or uninitialized global variable 'notDefinedVariable' and WARNING line 47 in file:/Users/Dogild/Downloads/Starter/NewApplication/AppController.j: Using unknown class or uninitialized global variable 'withAnotherNotDefinedVariable'.
The Console shows an error as well: ReferenceError: Can't find variable: notDefinedVariable. In this example the cause is obvious, but sometimes it’s not. Let’s imagine you can’t find the cause.
When an unmatched exception is logged, it’s too late to go back and see the cause. The debugger has to be enabled before the error.
Go to the Script tab (Safari) or the Sources (Chrome), and click on the “Enable Debugging” button:
The Debugger will become activated. Make sure to click the All Exceptions breakpoint icon. This activates the “Pause on [uncaught] exceptions” feature.
Reload the application. When the error occurs, the debugger will stop JavaScript execution when it encounters an exception:
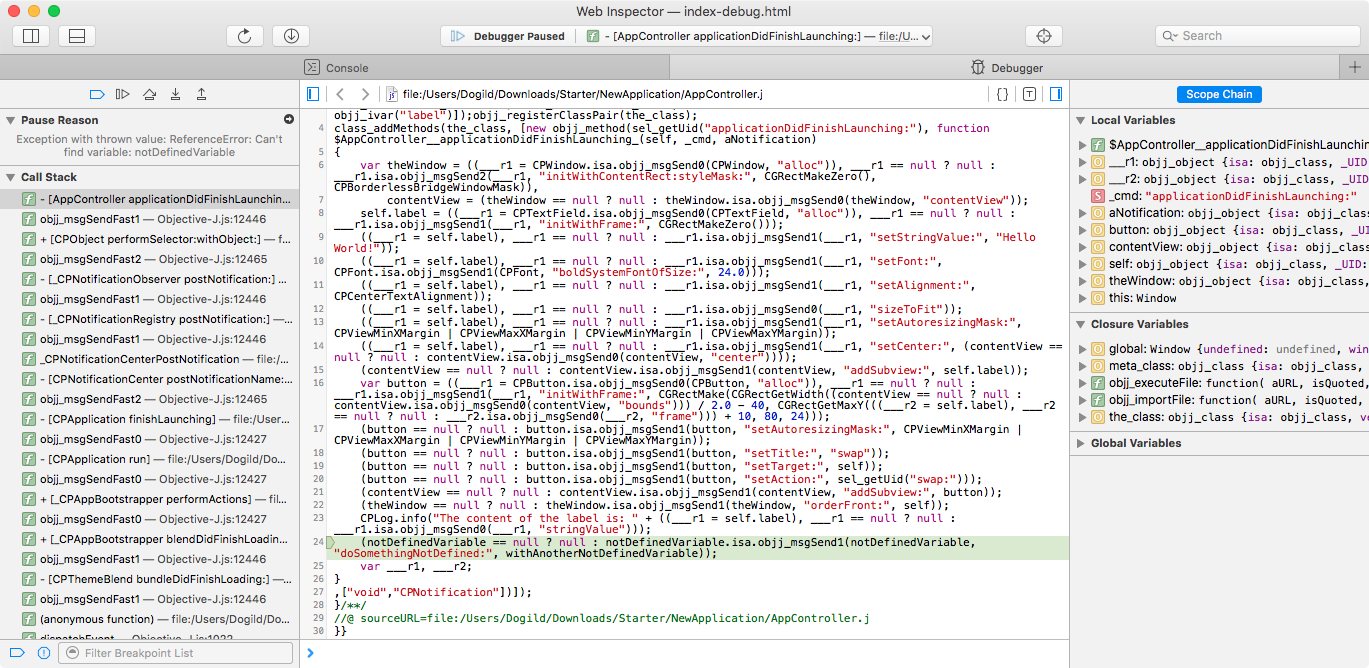
On the left side, you can see the Call Stack of the application. This contains methods called internally by Cappuccino.
In the middle you have your code compiled by Cappuccino. The debugger has stopped on the line of code that caused the exception.
On the right side you can see the local variables of the current scope, the closure(s) and the global scope. (There are quite a few global variables in Cappuccino.)
Note that the code has been compiled from Objective-J to JavaScript by Cappuccino at this point, so the code does not look exactly like your original code. For example:
[myObject saySomething:@"hello"];
Is compiled into:
(myObject == null ? null : myObject.isa.objj_msgSend1(myObject, "saySomething:", "hello"));
If you want to delve into the depths of the Objective-J runtime, take a look at the equivalent documentation for Objective-C: Apple’s developer documentation. For the most part you don’t need to understand it perfectly to find out what’s wrong with your original code though.
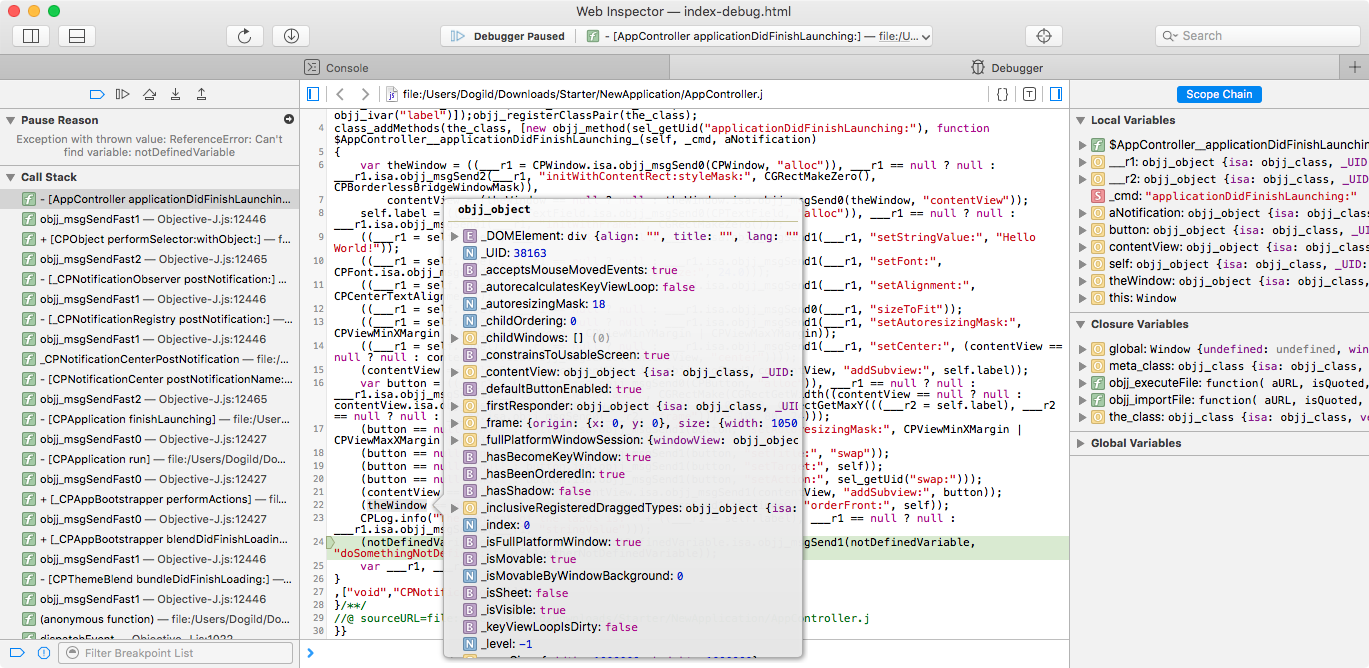
The Call Stack shown on the left hand side of the Debugger allows you to click on earlier calls in the execution stack to inspect what was going on at that point. You can also display the content of your objects by putting the mouse over a declaration:
Breakpoints allow you to specify points where code execution should automatically pause. You can place breakpoints by clicking line numbers of code in the Scripts (Safari) or Source (Chrome) tab. Sometimes these don’t stick around when you reload the app though so an easier way is to use the debugger statement in code.
:::objj
- (void)applicationDidFinishLaunching:(CPNotification)aNotification
{
    var theWindow = [[CPWindow alloc] initWithContentRect:CGRectMakeZero() styleMask:CPBorderlessBridgeWindowMask],
        contentView = [theWindow contentView],
        label = [[CPTextField alloc] initWithFrame:CGRectMakeZero()];

    [label setStringValue:@"Hello World!"];
    [label setFont:[CPFont boldSystemFontOfSize:24.0]];

    debugger; // the breakpoint!

    [label sizeToFit];

    [label setAutoresizingMask:CPViewMinXMargin | CPViewMaxXMargin | CPViewMinYMargin | CPViewMaxYMargin];
    [label setCenter:[contentView center]];
    [contentView addSubview:label];
    [theWindow orderFront:self];
}
If the JavaScript debugger is active when you reload the app you will see it stop execution when the debugger statement is executed;
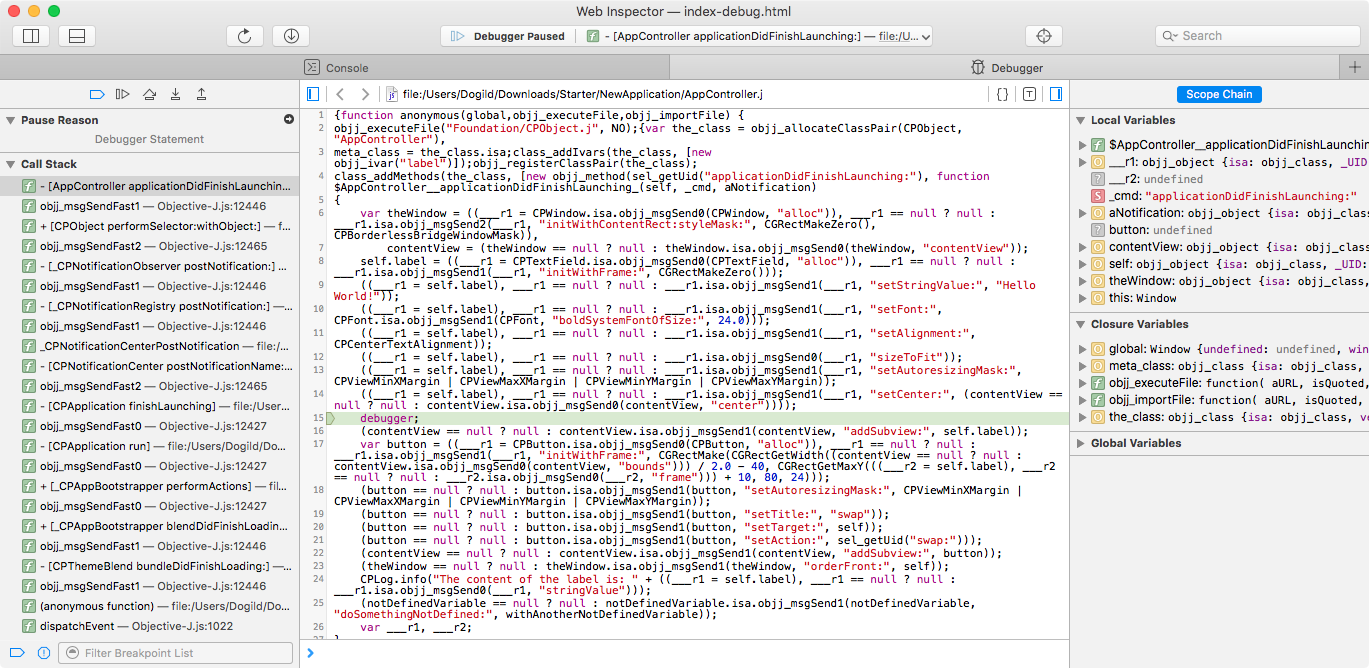
From here you can inspect the code, or single step forward using the debugger buttons.
The WebKit’s developer tools (and JS debuggers in general) have became extremely powerful tools. This tutorial only covers the basics. There is additional documentation available for Safari from Apple: Apple’s documentation.

![]() Logo by Sofa. Hosted by SlevenBits. Copyright © 2013-2019 - Cappuccino Project.
Logo by Sofa. Hosted by SlevenBits. Copyright © 2013-2019 - Cappuccino Project.