Programming for the browser is significantly different from other programming environments like a desktop OS, or even server side code. Cappuccino is largely aimed at minimizing these differences, but to be most productive you’ll need to be familiar with the right set of tools. This tutorial is aimed at identifying the most useful tools for developing Cappuccino applications. If you’re already ready to start programming your first Cappuccino application, skip ahead.
The browser is the most important part of the development cycle. Cappuccino apps target the browser just like Cocoa apps target Mac OS X. Choosing the right browser for your development cycle is a crucial step in the process.
There’s no one right answer to the question of which browser you should be using. There are four obvious contenders: Safari, Chrome, Firefox and Internet Explorer.
Google’s Chrome is the most popular choice, especially because the shipping version has a great set of developer tools. There is a full featured debugger, profiler, and HTTP monitor.
Chrome is based on Safari’s rendering technology and is generally very similar to Safari in terms of speed and rendering fidellity. The JavaScript engine is however different with different performance characteristics.
Safari is a fast, modern browser for the Mac.
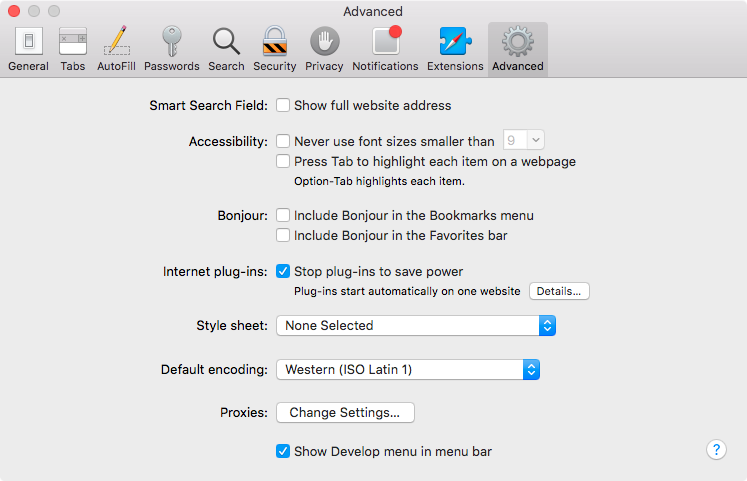
While its developer tools have recently been falling behind Chrome’s and can be frustrating to use due to slowness, they are still fairly complete. To access the inspector, you’ll need to check the “Show Develop menu in the menu bar” checkbox in the Advanced section of the preferences.
Some web developers choose to go with the latest version of Firefox. Its Firebug extension was one of the first Javascript debugging toolkits. Firebug gives you features for debugging your applications like stack traces on exceptions, a JavaScript profiler for finding performance hot spots, and a monitor for all your http traffic, including XMLHTTPRequests. If you’re going to use Firefox, Firebug is really an essential add-on to have.
If you’re choosing between Chrome, Safari and Firefox, both Chrome and Safari are faster browsers than Firefox, especially at JavaScript. Although all three browsers are fast, when you’re in the rapid development cycle of programming, refreshing, and testing your changes, the extra speed boost can be useful.
Cappuccino works great in IE, and you should test your application in IE as often as possible. It is not recommended as a development environment though. IE’s JavaScript interpreter is the slowest of the modern browsers, and it has some of the worst debugging tools.
That being said, since you should and will need to use IE from time to time, it’s useful to know that there are tools out there to make your experience better. One is Companion.js, a tool that provides an interactive DOM inspector and JS console. Another is the MS Script Debugger, which is required for parts of Companion.js to function properly, but is useful in its own right.
You can use whatever code editor you’re familiar and comfortable with. Preferably you’ll want one that at least supports JavaScript as a native language. Since Objective-J is very close to JavaScript, it makes the best choice for an editing mode if native Objective-J support is unavailable.
The following table shows some popular editor choices:
| Editor | Platform | Syntax coloring | Linting |
|---|---|---|---|
| Emacs | All | Yes | No |
| SubEthaEdit | Mac OS X | Yes | No |
| SublimeText | All | Yes | Yes (live) |
| TextMate | Mac OS X | Yes | Yes (not live) |
| vi | All | Yes | No |
If you use another text editor, and have written or would like to write an add-on for it to support Objective-J, we strongly encourage it and will list it here. Get in touch with us on the mailing list.
Xcode is the Apple’s IDE to build Cocoa application. Thanks to Cappuccino’s affinity with Cocoa, you can build your user interfaces in Xcode and convert the output files to Cappuccino ready UI archives. For that you’ll require these tools:
XIB (native Cocoa UI file) to CIB (native Cappuccino UI file)Xcode is not required to build great Cappuccino apps. It is however a very valuable tool that could save you hundreds of hours of work and drastically reduce the total amount of code for you to write, debug and manage.
Logging is an important part of the development process, especially when a debugger isn’t available. Over the years, people have adapted various methods of logging in web applications. All of those methods will still work, and you should use them if you have a favorite.
Cappuccino does come with its own built in logger. CPLog is modeled
after Apache’s log4j, and is easy to use. Anywhere in your code, you can
simply call CPLog("a message") to print that log. You can also use
CPLog.error("an error"), CPLog.debug("a debug message"), and others.
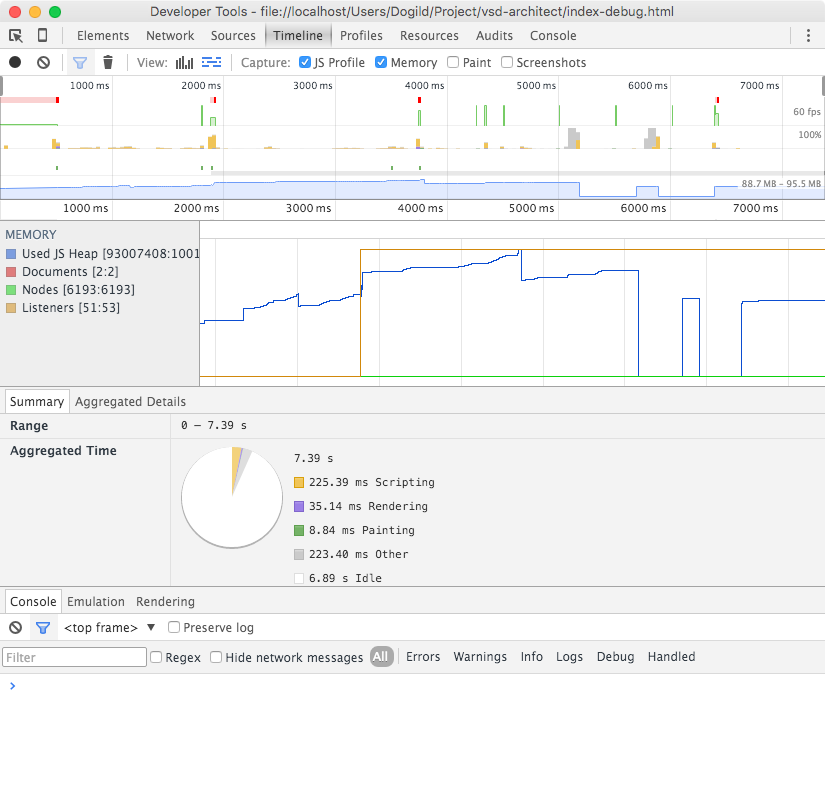
Logs are displayed in a popup log window, but they’re turned off by
default. To enable them, load index-debug.html instead of index.html.
So, if I’m developing at:
http://localhost:8000/MyApp/
I would instead go to:
http://localhost:8000/MyApp/index-debug.html
to enable the debug console. This debug version of index.html uses
un-minified versions of the frameworks, which can make debugging easier.
The console can also be enabled by calling CPLogRegister(CPLogPopup) in
your code.
For those developers used to languages like Java, C++, or Objective-C, where the compiler is readily available to show you syntax and type errors, changing to Objective-J and JavaScript can be confusing at first. You will not be able to rely on a compiler to find these kinds of problems for you. Most of them will be found by the browser when you first load your application, and you’ll find those errors buried in the JavaScript console of your respective browser. It’s in the Debug menu in Safari, and in the Tools menu of Firefox (if you have Firebug installed, errors will appear in Firebug instead).
It’s important to run your code often to make sure it still works. You don’t want to end up with 300 new lines of code and no clue where the error has occurred. This is somewhat exacerbated by the fact that Objective-J has difficulty reporting the actual line number of errors. So remember to run your code often, and make use of the error console and the other tools you have available when you encounter trouble.
If you have suggestions for improvements to this guide, or if you have questions that haven’t been answered here, please let us know on gitter.

![]() Logo by Sofa. Hosted by SlevenBits. Copyright © 2013-2019 - Cappuccino Project.
Logo by Sofa. Hosted by SlevenBits. Copyright © 2013-2019 - Cappuccino Project.